
Getting Started#
PyGeoStat is a Python package for geostatistical data handling, visualization, and scripting geostatistical workflows. It builds on the standard Python scientific stack and is designed to support reproducible, scriptable analysis.
If you are new to pygeostat, this page will help you verify your installation, run a minimal working example, and understand where to go next.
For a complete walkthrough using real data, see the Introduction example.
Prerequisites#
This guide assumes basic familiarity with the Python scientific ecosystem:
NumPy for numerical computing
Pandas for tabular data
Matplotlib for plotting
PyGeoStat does not replace these tools — it builds on them. If you are unfamiliar with any of the above, we recommend reviewing their introductory guides first.
If you are new to Python in general, see the official Python tutorial.
Verify Your Installation#
After installing pygeostat, verify that it is available in your environment:
import pygeostat as gs
print(gs.__version__)
If this runs without errors, pygeostat is installed correctly.
A Minimal Example#
The quickest way to see pygeostat in action is to load example data and create a simple plot.
import pygeostat as gs

# Load example dataset
data = gs.ExampleData('oilsands')

# Create a histogram
gs.histogram_plot(data, var='Bitumen')
This example demonstrates:
Loading built-in example data
Calling a pygeostat plotting function
Producing a visualization with minimal setup
Understanding the PyGeoStat Workflow#
In general, most pygeostat workflows follow a similar pattern:
Load data into a DataFile
Inspect or transform the data
Visualize or analyze
Export results
For example:
import pygeostat as gs

data = gs.ExampleData('oilsands')

# Inspect data
print(data.head())
print(data.describe())

# Plot spatial locations
gs.location_plot(data, var='Bitumen')
The DataFile class is the central data container used throughout pygeostat.
It wraps tabular spatial data while preserving metadata needed for
geostatistical analysis and plotting.
Finding Functions and Classes#
PyGeoStat provides a large number of functions and classes. You can explore available functionality in several ways:
Browse the full API reference: Index
Use tab completion in your editor (e.g., type
gs.and press Tab)Learn through examples in the documentation
The API reference is organized by module and provides detailed documentation for each function and class.
Domain-Specific Example: Swath Plot#
The following example demonstrates a geostatistical diagnostic plot commonly used in resource modeling workflows
import pygeostat as gs
datafl = gs.ExampleData('3d_estimate').data
data = datafl[['x', 'y', 'z','True', 'Estimate']]

# swath plot
for orient in ['x','y','z']:
   swath = data.groupby(orient)[['True', 'Estimate']].mean()
   swath.plot(title = f'{orient.upper()} Axis Swath Plot')
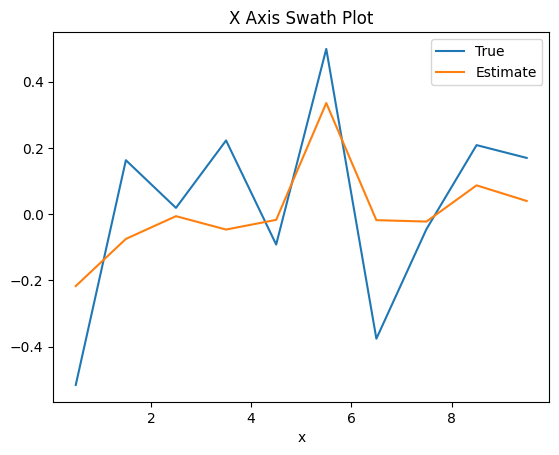
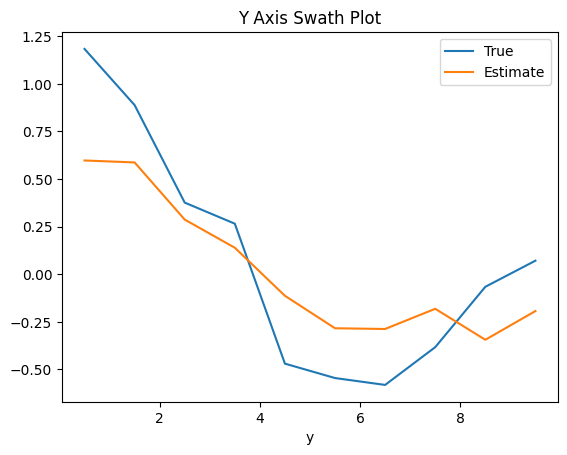
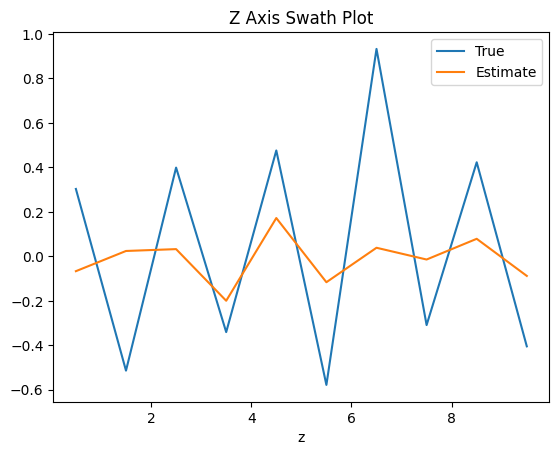
This type of plot is useful for assessing spatial trends and comparing estimated values against reference data.
Next Steps#
Once you are comfortable with the basics, we recommend the following path:
📘 Work through the Introduction example
📊 Explore the Plotting Functions section
📚 Browse the API Reference to discover available tools
🧪 Review the Examples for complete workflows
Getting Help#
If you encounter issues:
Check the documentation and examples first
Search existing issues on GitHub
Report bugs or ask questions via the project issue tracker
When reporting problems, please include:
Your Python version
Your pygeostat version
A minimal reproducible example